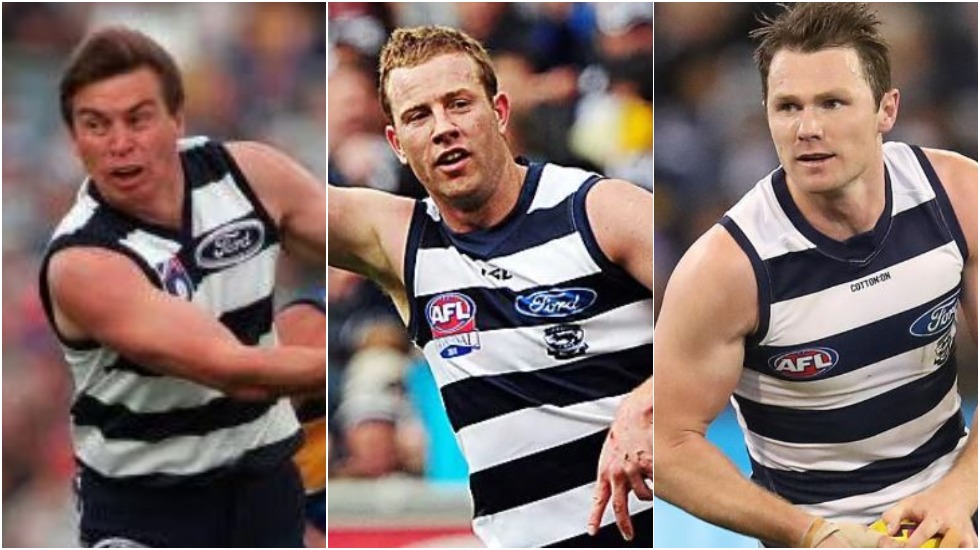
Three different eras, three strong versions of Geelong. From left, Paul Couch, Steve Johnson and Patrick Dangerfield
For those of a certain age, Richmond is seemingly at the wrong end of the ladder, likewise Hawthorn. West Coast and Geelong are pretty much where they’re expected to be, but not Sydney and definitely not Adelaide.
Readers who have lived through the AFL era will know where I’m going with this; younger folks stick with me. It’s about where we as followers tend to rank opposing clubs, as well as our own, in the hierarchy of success and failure.
For instance, for all of Brisbane’s brutal premiership dominance in the early 2000s, and Richmond’s series of car crash seasons and board turmoil, Tuesday night’s touch-up was the 15th win in a row by the Tigers over the Lions. Go figure.
For all of the recent ascendancy of Greater Western Sydney – and the swagger that has accompanied it – the club’s overall win/loss record remains mediocre.
And may it be uttered here: for the hundreds of millions of dollars that have been pumped into the Gold Coast Suns over the past decade, the club’s record in the AFL era is the worst overall. Worse than that of Fitzroy, which was wound up in 1996 over doubts that a $1.25 million loan could be repaid.
So which team is the best in the AFL era? What defines the best in any event?
Going by premiership success, the Hawks are clearly in front. Since 1990, when the competition was re-badged as the AFL, Hawthorn has won five flags, West Coast four, Geelong and Brisbane three apiece.
But which club has actually won the most games? Done the hard yards from March through to August, at home and far away. Well, there’s the clue.
The answer is Geelong.
Over the course of the last 29 seasons, the Cats have averaged just shy of 14 wins per season, a model of consistency under the likes of coaching messiahs Blight, Thompson and Chris Scott. Put simply, for every three home and away games, Geelong wins two.
The Eagles are hot on Geelong’s heels, with a record that is also remarkably consistent. Behind those two clubs come Hawthorn – no surprises there – and Collingwood.
Perhaps the biggest surprise on the AFL ladder for the era is the lowly position of Brisbane. Footscray/Western Bulldogs (one flag) and St Kilda (no flags but thrice runners up) hold their own outside the eight, while North Melbourne’s overall position at fifth might surprise.
Here, then (below), are the average match points per season for each club over the course of the AFL era:
As can be seen, over the last three decades only six clubs average more than 12 wins per season. The middle grouping – Adelaide, Port Adelaide, Sydney and Footscray/Western Bulldogs – win as many games as they lose, and of the established clubs, Melbourne’s record is the poorest.
But there is hope. Richmond has moved swiftly up the table on the back of standout seasons and the Giants are climbing. The Bombers have tumbled from where they stood on the cusp of the millennium but remain sixth overall despite not having teams that threaten in September.
What should be sobering to the powers that be is the gap between best and worst.
The PR around tighter games is nonsense – average margins have barely changed in 20 years – and for all of the well-meaning equalisation measures, the likes of Geelong and West Coast typically win eight more games per season than the likes of Gold Coast and five more than the likes of Melbourne.
Is it culture? Is it resources? Is it leadership? One would suggest the difference between successful clubs and the rest is a combination of all three. On the points side of things, here is 30 years of evidence.
AFL LADDER 1990 – 2019
Geelong 55.7
West Coast 54.1
Hawthorn 51.4
Collingwood 49.2
North Melb 48.9
Essendon 48.5
Adelaide 47.3
Port Adelaide 46.9
Sydney 46.7
Footscray/WB 45.5
St Kilda 41.7
Richmond 41.6
Carlton 40.1
Fremantle 38.9
GWS 38.7
Brisbane Bears/Lions 38.6
Melbourne 36.6
Fitzroy 21.7
Gold Coast 21.1


Dear Elliot
Was your reference to Richmond “touching up” Brisbane a snide swipe at Nick Vlaustin and his proclivities revealed during the singing of the post-match song?