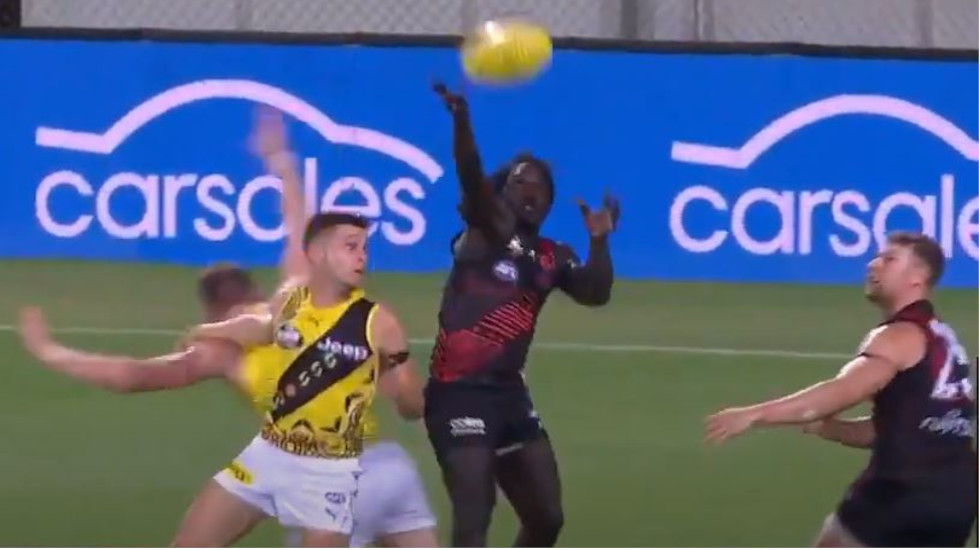
Richmond’s Dylan Grimes (left) throws himself forward after contact from Essendon’s Jake Stringer. Picture: CHANNEL 7
We lost? Bloody umpires. We won? Gee, the umps were pretty good today.
Of all the muddle-headed brickbats which footy fans instinctively revert to, blaming umpires for our own team’s failure or attributing umpiring bias for another team’s success has been the dead-set favourite since Carji Greeves took home the first Brownlow bling.
More recently, the cry “free kick Hawthorn!” did its tiresome rounds, year after year during the club’s triple premiership success. This season, the blowtorch is on the Tigers, most particularly after two contentious decisions in the Round 13 clash against Essendon.
Right from the outset, let me state that neither incident warranted sanction; Dylan Grimes exacerbated a hand in the back from Jake Stringer, and fellow Tiger Nick Vlastuin milked high contact from his Bomber opponent, Tom Bellchambers.
But according to the military-drilled, pernickety adjudication these days, the unfortunate red-and-black duo gave the respective umpires just enough ammunition to blow the whistle.
Now, let’s put aside the emotion and go to the data.
Essendon was on the back foot for much of the game, most tellingly with field position and shots at goal. Sixty-six inside 50s to only 24 in Richmond’s favour, 23 scores to 11 and an overall free kick count of 13-12, makes light of the suggestion that the Bombers would have won had those two decisions gone their way.
Likewise, the tag of “protected species” aimed at Richmond that lit up social media in the aftermath, for the data strongly refutes the notion that the Tigers get a favourable run.
In 2017 and 2018, flag and preliminary final years for Richmond, the club was ranked second last and last in the competition’s overall free kick differential. In 2019, another flag year, the Tigers ranked sixth last. This season to date, the club is in the same position as Essendon, -30 on the plus/minus differential.
It’s just as pronounced when it comes to Hawthorn’s 21st century success. Once again, the data does not back the assertion of a golden run from umpires.
PLEASE HELP US CONTINUE TO THRIVE BY BECOMING AN OFFICIAL FOOTYOLOGY PATRON. JUST CLICK THIS LINK.
To start with, in Alastair Clarkson’s first flag season in 2008, the Hawks were last by some margin on the AFL’s free kick differential; their grand final opponents, Geelong, were second.
Fast forward to 2013-15. Across the three premiership seasons, Hawthorn was awarded only 26 more free kicks compared to frees against. That’s an average of fewer than nine more frees than given away per season.
By way of contrast, their regular finals combatant in those years, Fremantle, conceded 150 more frees than earned. On the flip side, West Coast ran plus 213 for frees between 2013 and 2015, way out in front of any side.
The Eagles, some say inexplicably, others say due to hometown crowd factors, lead the AFL’s free kick differential by a country mile. Since 2003, West Coast is the only club to have never entered the red; for 17 completed seasons in a row, the Eagles have been awarded more free kicks than against.
The plus/minus differential ladder (see below) is startling in that regard. Indeed, it should help to settle some pub arguments, albeit virtual arguments in parts of Australia at present.
Since the commencement of season 2003, West Coast has played 413 matches, including finals, with a differential to the positive of 924. Broken down, on average the Eagles are awarded 2.2 more free kicks than frees against – every single game.
At the foot of the table lies Sydney, with a staggering differential of 1490, in direct contrast to West Coast. The Swans have played 410 matches including finals over that time, with a differential to the negative of 566. That’s an extra 1.4 free kicks given away than awarded – every single game.
From an analytical perspective, it makes for perplexing reading. Both clubs have enjoyed consistent success over that time, making a combined 63 finals appearances and winning two premierships each.
Does it mean the Swans play a less “sociable” brand of footy than their Western Australian counterparts? Possibly. Does it mean, if umpires are at times influenced by crowd noise, that the atmosphere in Perth is somewhat more partisan than Sydney? Probably.
Note also the high position of North Melbourne, a side maligned in some quarters under the coaching auspices of both Brad Scott and Rhyce Shaw as indulging in some of the less savoury physical aspects of our game.
Like many of the subjective opinions we hold, the data suggests otherwise.
AFL plus/minus free kick ladder 2003 – 2020 (to Round 13)
West Coast 924
North Melbourne 531
Western Bulldogs 423
Collingwood 337
Carlton 261
Adelaide 153
Geelong -15
Port Adelaide -28
Richmond -86
Gold Coast -189
Melbourne -190
Essendon -204
Brisbane -205
St Kilda -232
Fremantle -263
GWS -300
Hawthorn -387
Sydney -566


Would love to see those West Coast numbers split between home and away games. Suspect the differential in home games is even more pronounced.
As a Richmond supporter I’ve don’t worry about it any more. Umpires make mistakes, players make mistakes.
I love how the game would have stayed the same in spite of the decision. The game reverts as soon as it goes back to the middle.
Some Richmond fans complain about one of the umpires giving a lot of decisions against the Tigers.
So what I say.
The free kick differential is irrelevant if all of the decisions are correct, am I paying to have somebody nicely layout the free kick count for the last 10 years? Seems very shallow. Limited discussion on how different game styles effect things.
Its not about the free kick count the umpires get it right most of the time its the errors that are costly that hurt and stand out most. Take a look last night. Richmond free kick to Jack Riewoldt, umpire poorly positioned gave a push in the back. Goal Richmond. Dying seconds of the second quarter Jamie Cripps dragged down with out the ball on the goal line, kick not paid. In those two kicks that is two goals to Richmond effectively. Yet West Coast won the free kick count.
Probably a question more for a psychologist, but could the colours of the jumper come into it? 6 of the top 7 have blue in their jumper which certainly stands out.
On a game-by-game basis I’m in agreement, it’s not purely the count that can reflect any umpiring faults or biases because a dodgy free straight in front is not equal to a dodgy free on the half-back flank. But the free kick count is the only statistical/objective measure of umpiring we really have (I don’t think an umpire-by-umpire free kick count is readily available?), and over such a long period of time it isn’t just coincidence that West Coast are three standard deviations above the mean, and so far ahead of every other club. Also see Margetts’ influence on their games – https://bit.ly/3lsJ44e.